Skip directly to site content Skip directly to page options Skip directly to A-Z link Skip directly to A-Z link Skip directly to A-Z link
Volume 26, Number 8—August 2020
Research

Population Genomic Structure and Recent Evolution of Plasmodium knowlesi, Peninsular Malaysia

Suzanne E. Hocking, Paul C.S. Divis, Khamisah A. Kadir, Balbir Singh, and David J. ConwayComments to Author 
Author affiliations: London School of Hygiene and Tropical Medicine Department of Infection Biology, London, UK (S.E. Hocking, D.J. Conway); Universiti Sarawak Malaysia Malaria Research Centre, Kota Samarahan, Malaysia (P.C.S. Divis, K.A. Kadir, B. Singh, D.J. Conway)

Main Article

Figure 7

Scan for evidence of genomic regions affected by recent positive directional selection in Plasmodium knowlesi in Peninsular Malaysia, using the standardized integrated haplotype score |iHS| index. Examination of the ranges of extended haplotype homozygosity for individual single-nucleotide polymorphisms (SNPs) with high |iHS| values identified 4 distinct genomic windows of extended haplotypes (Appendix 2 Datasheet 3). Two of these (in chromosomes 1 and 9) spanned across SICAvar and kir genes, wh

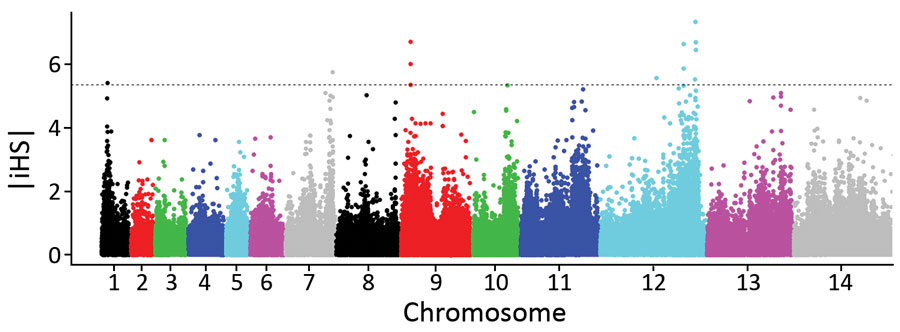
Figure 7. Scan for evidence of genomic regions affected by recent positive directional selection in Plasmodium knowlesi in Peninsular Malaysia, using the standardized integrated haplotype score |iHS| index. Examination of the ranges of extended haplotype homozygosity for individual single-nucleotide polymorphisms (SNPs) with high |iHS| values identified 4 distinct genomic windows of extended haplotypes (Appendix 2 Datasheet 3). Two of these (in chromosomes 1 and 9) spanned across SICAvar and kir genes, which were masked from SNP calling, whereas the other 2 did not include SICAvar or kir genes but covered ≈28 kb on chromosome 7 and ≈315 kb on chromosome 12. The large region on chromosome 12 is a merged window, consisting of 4 high |iHS| core SNPs with overlapping windows of extended haplotype homozygosity, and coincides with the region of chromosome 12 that has the highest genomic divergence between cluster 3 population subclusters A and B (Figure 5, panel D).

Main Article

Page created: May 18, 2020
Page updated: June 25, 2020
Page reviewed: June 25, 2020
The conclusions, findings, and opinions expressed by authors contributing to this journal do not necessarily reflect the official position of the U.S. Department of Health and Human Services, the Public Health Service, the Centers for Disease Control and Prevention, or the authors' affiliated institutions. Use of trade names is for identification only and does not imply endorsement by any of the groups named above.
file_external