Volume 29, Number 9—September 2023
Synopsis
Participatory Mathematical Modeling Approach for Policymaking during the First Year of the COVID-19 Crisis, Jordan
Saverio Bellizzi1 , Nicholas Letchford1, Keyrellous Adib1, William J.M. Probert, Penelope Hancock, Lora Alsawalha, Alessio Santoro, Maria C. Profili, Ricardo Aguas, Christian Popescu, Lubna Al Ariqi, Lisa White, Wail Hayajneh, Nathir Obeidat, and Pierre Nabeth
Figure 1
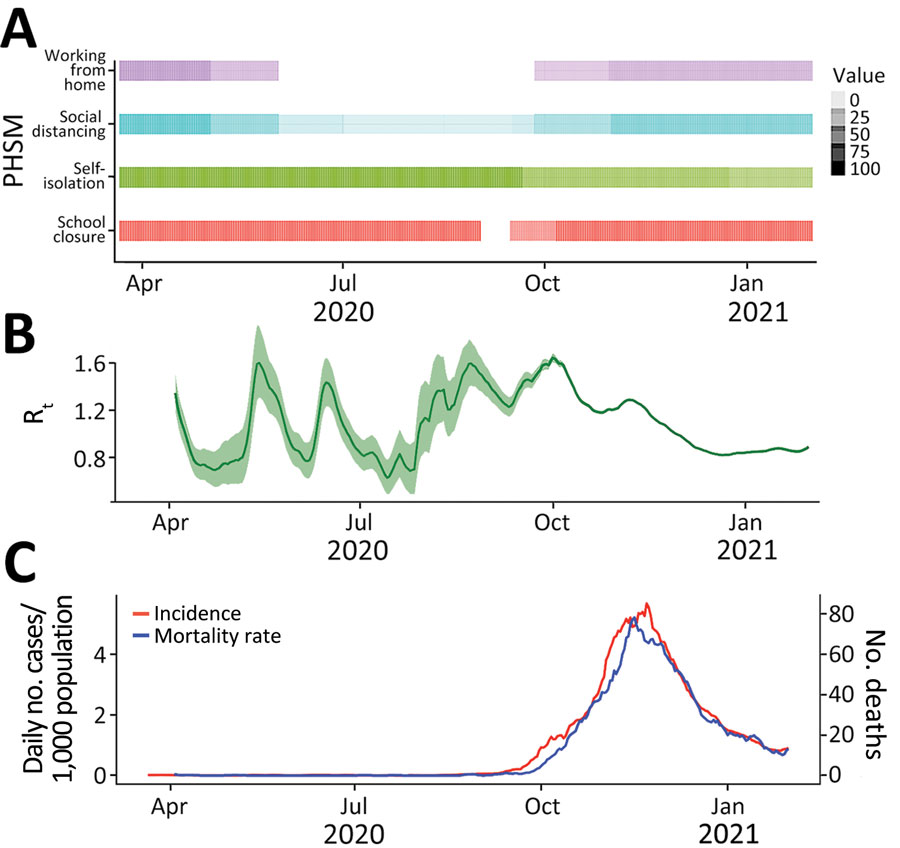
Figure 1. Epidemiologic indicators and PHSMs in a COVID-19 modeling study, Jordan, March 2020–January 2021. A) Timeline of implemented PHSMs. Colors indicate individual PHSMs; level of shading represents the coverage of each intervention in the timeline, ranging from 0% to 100%. B) Estimated Rt, calculated using the EpiEstem package in R (https://CRAN.R-project.org/package=EpiEstim), which presents the number of new case-patients infected by an average case-patient at time t. Green shading indicates 95% CI. C) Daily incidence and mortality rates for COVID-19 in Jordan. PHSM, public health and social measure; Rt, effective reproduction number.
1These first authors contributed equally to this article.
Page created: July 06, 2023
Page updated: August 20, 2023
Page reviewed: August 20, 2023
The conclusions, findings, and opinions expressed by authors contributing to this journal do not necessarily reflect the official position of the U.S. Department of Health and Human Services, the Public Health Service, the Centers for Disease Control and Prevention, or the authors' affiliated institutions. Use of trade names is for identification only and does not imply endorsement by any of the groups named above.