Participatory Mathematical Modeling Approach for Policymaking during the First Year of the COVID-19 Crisis, Jordan
Saverio Bellizzi
1
, Nicholas Letchford
1, Keyrellous Adib
1, William J.M. Probert, Penelope Hancock, Lora Alsawalha, Alessio Santoro, Maria C. Profili, Ricardo Aguas, Christian Popescu, Lubna Al Ariqi, Lisa White, Wail Hayajneh, Nathir Obeidat, and Pierre Nabeth
Author affiliations: World Health Organization Jordan Country Office, Amman, Jordan (S. Bellizzi, L. Alsawalha, A. Santoro, M.C. Profili, C. Popescu); World Health Organization Regional Office for Eastern Mediterranean, Cairo, Egypt (N. Letchford, K. Adib, W.J.M. Probert, Penelope Hancock, L. Al Ariqi, P. Nabeth); Nuffield Department of Medicine, University of Oxford, Oxford, UK (R. Aguas, L. White); SSM Health Cardinal Glennon Children's Hospital, St. Louis University, St. Louis, Missouri, USA (W. Hayajneh); Jordan University Hospital, Amman (N. Obeidat)
Main Article
Figure 4
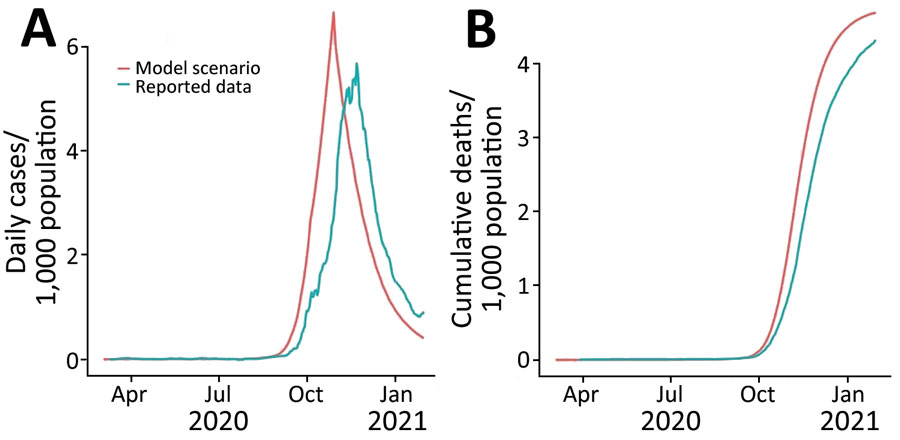
Figure 4. Comparison of COVID-19 incidence (A) and cumulative deaths daily (B) under model scenario A compared with reported data in a COVID-19 modeling study, Jordan, March 2020–January 2021. Scenario A assumes the entire population, excepting essential services, will physically distance themselves for 24 hours every Friday while reverting to their usual behavior on the other days of the week. The scenario is defined by 2 key parameters: coverage and adherence. On days when the physical distancing intervention was enforced, the simulation assumes 60% of the population is following physical distancing regulations (coverage) and that those persons spend 80% of their time adhering to the intervention (adherence).
Main Article
Page created: July 06, 2023
Page updated: August 20, 2023
Page reviewed: August 20, 2023
The conclusions, findings, and opinions expressed by authors contributing to this journal do not necessarily reflect the official position of the U.S. Department of Health and Human Services, the Public Health Service, the Centers for Disease Control and Prevention, or the authors' affiliated institutions. Use of trade names is for identification only and does not imply endorsement by any of the groups named above.