Skip directly to site content Skip directly to page options Skip directly to A-Z link Skip directly to A-Z link Skip directly to A-Z link
Volume 29, Number 9—September 2023
Synopsis

Participatory Mathematical Modeling Approach for Policymaking during the First Year of the COVID-19 Crisis, Jordan

Saverio Bellizzi1Comments to Author , Nicholas Letchford1, Keyrellous Adib1, William J.M. Probert, Penelope Hancock, Lora Alsawalha, Alessio Santoro, Maria C. Profili, Ricardo Aguas, Christian Popescu, Lubna Al Ariqi, Lisa White, Wail Hayajneh, Nathir Obeidat, and Pierre Nabeth
Author affiliations: World Health Organization Jordan Country Office, Amman, Jordan (S. Bellizzi, L. Alsawalha, A. Santoro, M.C. Profili, C. Popescu); World Health Organization Regional Office for Eastern Mediterranean, Cairo, Egypt (N. Letchford, K. Adib, W.J.M. Probert, Penelope Hancock, L. Al Ariqi, P. Nabeth); Nuffield Department of Medicine, University of Oxford, Oxford, UK (R. Aguas, L. White); SSM Health Cardinal Glennon Children's Hospital, St. Louis University, St. Louis, Missouri, USA (W. Hayajneh); Jordan University Hospital, Amman (N. Obeidat)

Main Article

Figure 3

Model-predicted heat map showing percentage reduction in COVID-19 incidence (top row) and deaths (bottom row) in a COVID-19 modeling study in Jordan under 3 different scenarios (A, B, and C), relative to the baseline scenario, aggregated for the period November 2020–January 31, 2021. Dark blue corresponds to nearly 100% reduction in incidence and cases relative to the baseline scenario; dark red corresponds to 0% reduction. Scenario A assumes the entire population, excepting essential services, will physically distance themselves for 24 hours every Friday while reverting to their usual behavior on the other days of the week. Scenario B assumes the population will physically distance themselves for the entire weekend (Friday and Saturday) while reverting to their usual behavior throughout the week. Scenario C assumes the entire population, except for essential services, will physically distance themselves for the entire week while never reverting to their usual behavior. Baseline scenario assumes no government intervention and half the population instinctively physically distances themselves to avoid infection. Common to each scenario are 2 parameters used to define the extent of the physical distancing intervention: coverage, which refers to the percentage of the population following physical distancing regulations, and adherence, which refers to the extent to which individual persons follow those guidelines. The coverage parameter was varied between values of 50% and 100% (presented on the horizontal axis of each heat map) on the days when the physical distancing intervention was enforced. On respective days when the interventions were not enforced, simulations assume the coverage was constant at 50%. The adherence parameter varied between 0% and 100% (presented on the vertical axis of each heat map), remaining constant throughout each simulation.

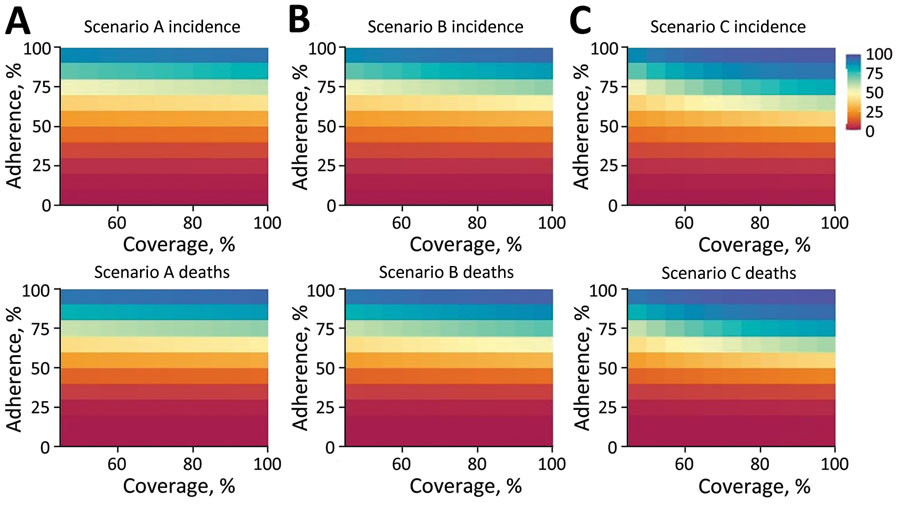
Figure 3. Model-predicted heat map showing percentage reduction in COVID-19 incidence (top row) and deaths (bottom row) in a COVID-19 modeling study in Jordan under 3 different scenarios (A, B, and C), relative to the baseline scenario, aggregated for the period November 2020–January 31, 2021. Dark blue corresponds to nearly 100% reduction in incidence and cases relative to the baseline scenario; dark red corresponds to 0% reduction. Scenario A assumes the entire population, excepting essential services, will physically distance themselves for 24 hours every Friday while reverting to their usual behavior on the other days of the week. Scenario B assumes the population will physically distance themselves for the entire weekend (Friday and Saturday) while reverting to their usual behavior throughout the week. Scenario C assumes the entire population, except for essential services, will physically distance themselves for the entire week while never reverting to their usual behavior. Baseline scenario assumes no government intervention and half the population instinctively physically distances themselves to avoid infection. Common to each scenario are 2 parameters used to define the extent of the physical distancing intervention: coverage, which refers to the percentage of the population following physical distancing regulations, and adherence, which refers to the extent to which individual persons follow those guidelines. The coverage parameter was varied between values of 50% and 100% (presented on the horizontal axis of each heat map) on the days when the physical distancing intervention was enforced. On respective days when the interventions were not enforced, simulations assume the coverage was constant at 50%. The adherence parameter varied between 0% and 100% (presented on the vertical axis of each heat map), remaining constant throughout each simulation.

Main Article

1These first authors contributed equally to this article.

Page created: July 06, 2023
Page updated: August 20, 2023
Page reviewed: August 20, 2023
The conclusions, findings, and opinions expressed by authors contributing to this journal do not necessarily reflect the official position of the U.S. Department of Health and Human Services, the Public Health Service, the Centers for Disease Control and Prevention, or the authors' affiliated institutions. Use of trade names is for identification only and does not imply endorsement by any of the groups named above.
file_external